# Benchmarking Angular
# The Problem Behind the performance Browser API
The performance API, especially the performance.measure method, is influenced by the speed of the computer and has a high variance factor. I have observed multiple instances where the results differed depending on the load on my computer.
These types of measurements are commonly referred to as "metastable."
# System Speed
In essence, the speed of systems can be characterized by metrics such as latency and throughput:
- latency refers to the time it takes for a single global change detection to traverse the entire component tree, starting from the root component and continuing until the very last one.
- throughput, on the other hand, represents the number of global change detections that can be executed within a fixed period of time.
It is important to note that increasing throughput can be achieved by reducing latency. To minimize latency, we need to decrease the number of local change detections since a global change detection comprises multiple local change detections for each component in the tree.
# Latency
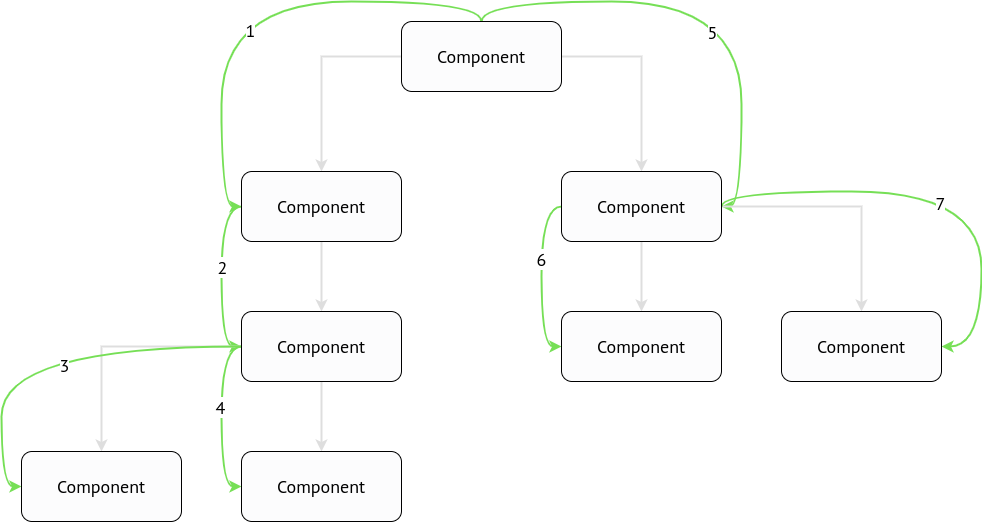
In the above example, the latency will be equal to the sum of the timings for each local change detection. There are a total of 8 local change detections in this scenario.

# Throughput
In any system that has a single-thread code execution, the throughput is calculated using the following formula:

# Angular built-in profiler
Angular already has a built-in change detection profiler which can be enabled in the development mode:
async function bootstrap() {
  const { injector } = await platformBrowserDynamic().bootstrapModule(AppModule);

  if (isDevMode()) {
    const { enableDebugTools } = await import('@angular/platform-browser');
    const { components } = injector.get(ApplicationRef);
    enableDebugTools(components[0]);
  }
}

bootstrap();
⚠️ Such code can be shipped to the repository only with
if (ngDevMode)condition.isDevMode()is a runtime function that has nothing to do with tree-shaking, thusenableDebugToolsandAngularProfilerwill be bundled into the production bundle.
Therefore it will be accessible in the window.ng property. Let's open the DevTools and run it:
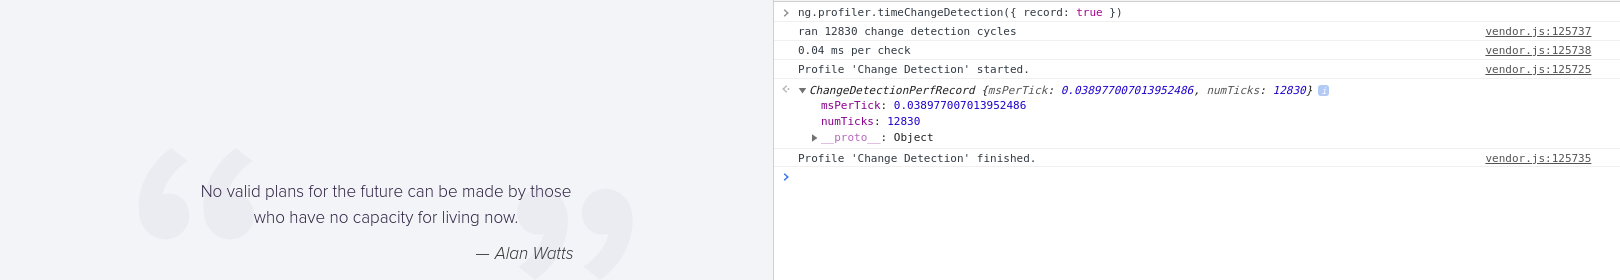
ng.profiler.timeChangeDetection({ record: true });
⚠️ The profiler runs ticks during 500 ms.
⚠️ The profiler doesn't take into account the presence of
OnPushcomponents. Even if the root component is marked asOnPush, theApplicationRef.tick()method will have no effect (i.e., it will act as a no-op).
Considering the image above, we can calculate the latency and throughput. If the latency is 0.04 ms per tick(), then the throughput can be determined by dividing 1000 ms (1 second) by 0.04, resulting in a throughput of 25000 change detections per second.
# Going deeper
We can still use the same Angular's built-in profiler, but we need to bypass OnPush checks.
# Bypassing OnPush checks in ViewEngine
There is a function called callViewAction that does OnPush checks:
function callViewAction(view, action) {
  switch (action) {
    case ViewAction.CheckAndUpdate:
      if ((viewState & 128) /* Destroyed */ === 0) {
        if ((viewState & 12) /* CatDetectChanges */ === 12 /* CatDetectChanges */) {
          checkAndUpdateView(view);
        } else if (viewState & 64 /* CheckProjectedViews */) {
          execProjectedViewsAction(view, ViewAction.CheckAndUpdateProjectedViews);
        }
      }
  }
}
The value of CatDetectChanges is calculated as Attached | ChecksEnabled, which is 8 (Attached) | 4 (ChecksEnabled) = 12. Therefore, (view.state & 12) === 12 will evaluate to true when the view is attached to the change detection tree (it can be detached by invoking detach() on the ChangeDetectorRef) and when checks are enabled.
When do checks become enabled? Angular invokes checkAndUpdateDirectiveInline, which is responsible for checking @Input() properties. If any binding has been modified, Angular then calls updateProp, which alters the view state.:
if (view.def.flags & 2 /* OnPush */) {
  view.state |= 8 /* ChecksEnabled */;
}
We can swap if conditions:
function callViewAction(view, action) {
  switch (action) {
    case ViewAction.CheckAndUpdate:
      if ((viewState & 128) /* Destroyed */ === 0) {
        if (viewState & 64 /* CheckProjectedViews */) {
          execProjectedViewsAction(view, ViewAction.CheckAndUpdateProjectedViews);
        } else {
          checkAndUpdateView(view);
        }
      }
  }
}
# Bypassing OnPush checks in Ivy
There is a function called refreshComponents that does OnPush checks:
function refreshComponent(hostLView, componentHostIdx) {
  ...
  if (componentView[FLAGS] & (16 /* CheckAlways */ | 64 /* Dirty */)) {
    refreshView(tView, componentView, tView.template, componentView[CONTEXT]);
  } else if (componentView[TRANSPLANTED_VIEWS_TO_REFRESH] > 0) {
    refreshContainsDirtyView(componentView);
  }
}
We can swap if conditions:
function refreshComponent(hostLView, componentHostIdx) {
  ...
  if (componentView[TRANSPLANTED_VIEWS_TO_REFRESH] > 0) {
    refreshContainsDirtyView(componentView);
  } else {
    refreshView(tView, componentView, tView.template, componentView[CONTEXT]);
  }
}
Let's run the profiler again:
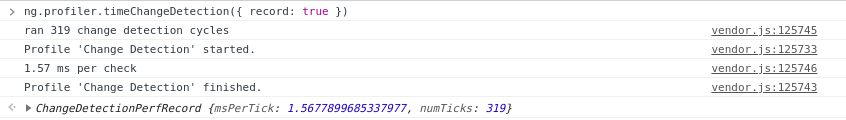
We can observe that the msPerTick value differs when OnPush checks are bypassed, indicating that all components are checked. Consequently, the throughput can be calculated as 1000 / 1.57 = 636 (change detections per second).
# Tracing the number of change detections
We have to be able to know how many change detections run per some component.
# ViewEngine
There is a checkAndUpdate function that is invoked for each component when the change detection is executed:
function checkAndUpdateView(view) {
  ...
}
function checkAndUpdateView(view) {
  const t0 = performance.now();

  // `checkAndUpdateView` body

  if (view.component.constructor !== Object) {
    const name = view.component.constructor.name;
    const t1 = performance.now();
    console.log(
      `%c${t1 - t0} ms`,
      'font-size: 14px; background: red; color: white;',
      ` checkAndUpdateView() took for ${name}`,
    );
  }
}
# Ivy
There is a refreshView function that is called for each component when the change detection is executed:
function refreshView(tView, lView, templateFn, context) {
  ...
}
We can place the single console.log to see how many times it's run for the specific component. Let's store the debuggable element in the global scope:
function refreshView(tView, lView, templateFn, context) {
  const debuggable =
    lView[HOST] !== null && lView[HOST].tagName.toLowerCase() === window.debuggable;
  if (debuggable) {
    console.log(`refreshView() is called for the ${window.debuggable}`);
  }
}

// Run this in the DevTools
window.debuggable = 'cu-task-editor';
We can also measure it's execution:
function refreshView(tView, lView, templateFn, context) {
  const debuggable =
    lView[HOST] !== null && lView[HOST].tagName.toLowerCase() === window.debuggable;
  const t0 = debuggable && performance.now();

  // `refreshView` body

  if (debuggable) {
    const t1 = performance.now();
    console.log(
      `%c${t1 - t0} ms`,
      'font-size: 14px; background: red; color: white;',
      ` refreshView() took for ${window.debuggable}`,
    );
  }
}
# Conclusion
As mentioned earlier, the execution time of the ng.profiler function is variable, and it generally doesn't consume a significant amount of time. Instead, our focus should be on monitoring the number of calls to these functions as they have the potential to cause frame drops.
While the ng.profiler can provide some insights, it may not be as useful as directing attention to frame drops and layout updates.